A Just Noticeable Difference: Measuring JND for Displays
There’s a lot of data used to characterize electronic displays: resolution, pixels per inch, refresh rate, luminance (nits), pixel pitch, dynamic range, contrast ratio, etc. All this information is meant to help convey the quality of a display. But ultimately, it is the visual experience of human users that will define a display’s performance—and largely determines its success in the marketplace. So how can display designers and manufacturers evaluate the quality of their products according to the standards of human viewers?
Using human quality inspectors has been one approach. But keeping up with market demand and the speed and volume of mass production has necessitated the implementation of automated inspection solutions. Quantifying the discernment of human visual perception—the ultimate quality standard—was a challenge until the National Aeronautics and Space Administration (NASA) developed a method to measure Just Noticeable Difference (JND) based on a Spatial Standard Observer (SSO).1
Origin of Just Noticeable Difference
The concept of Just Noticeable Difference was first articulated by 19th century psychologist Ernst Weber, who defined it as the “minimum amount by which stimulus intensity must be changed in order to produce a noticeable variation in sensory experience.”2 Weber’s law (or Weber-Fechner law) holds that the change in a stimulus (something viewed or sensed by a human subject, such as the luminance of a display screen) that will be just noticeable is a constant ratio to the initial stimulus.
This law generally holds true for all our senses, including sight, touch, taste, smell, and hearing, and for multiple types of stimuli including brightness, sweetness, weight, and pressure. The only exceptions tend to be in the extremes of a stimulus (for example, for displays in very high or low brightness states, the discernment threshold does not always have a constant ratio).
Spatial Standard Observer & JND
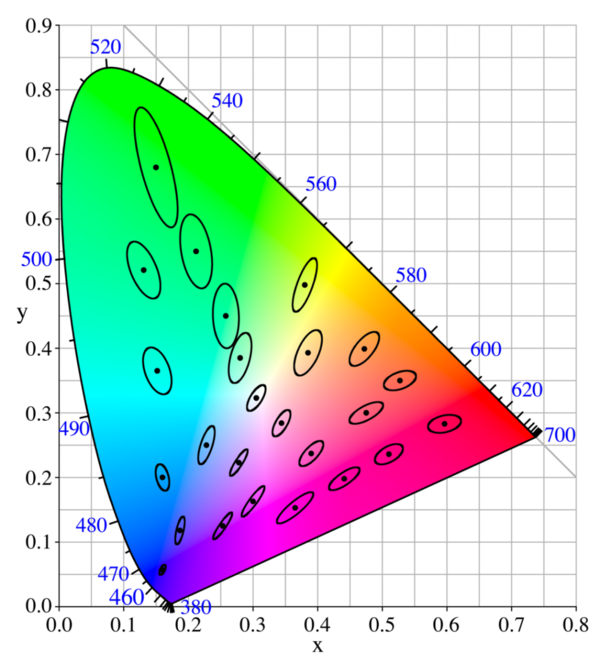
The “standard observer” is a construct that’s long been used in scientific and industrial efforts to quantify color. Researchers have gathered data from multiple test subjects to define “average” human visual perception. For example, MacAdam ellipses are a representation of regions on the chromaticity diagram where the colors inside each ellipse are indistinguishable to observers from the color at the center. The contour of each ellipse therefore represents the threshold of just noticeable differences of chromaticity to a (statistically) average human viewer. This means any given individual may or may not notice a difference, depending on where they lie on the sensitivity spectrum, but at least 50% of a group of observers will perceive a difference under ordinary conditions. A “just perceptible difference” (or JPD) refers to the smallest discernable difference under the most favorable viewing conditions .

MacAdam ellipses plotted on the CIE 1931 xy chromaticity diagram, shown ten times their actual size. Each ellipse represents a region in which all colors are indistinguishable from the color at the center of the ellipse, to an average human eye. (Image: CC BY-SA 3.0)
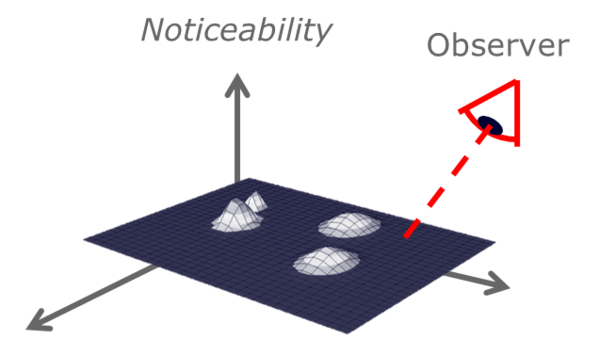
NASA’s Spatial Standard Observer model added a spatial element into the mix, creating a tool for measuring the visibility of an element, or the “visual discriminability” of two elements. As with the development of color JND, SSO was developed by collecting an extensive set of human test data to provide a calibrated model of human vision.
The SSO “computes a numerical measure of the perceptual strength of the single image, or the visible difference between the two images. The visibility measurements are provided in units of Just Noticeable Differences (JND), a standard measure of perceptual intensity.”2
This method was developed with numerous potential applications in mind, “most notably in the inspection of displays during the manufacturing process.”2 It is also useful for “evaluating vision from unpiloted aerial vehicles (UAVs); predicting visibility of UAVs from other aircraft; estimating visibility, from a control tower, of aircraft on runways; measuring visibility, from a distance, of damage on aircraft and on a space shuttle; evaluation of legibility of text, icons, or other symbols; specification of resolution of a camera or a display device…estimating the quality of compressed digital video imagery; and predicting the outcomes of corrective laser eye surgery.”3
Many industries rely on JND characterization to ensure the performance of displays in critical environments. For example, grayscale calibration is vital for medical displays being used to view radiographic images. JND is applied to aerospace and automotive displays that show vital information to the pilot/driver during operation. Regulatory standards in these industries call out JND as one factor to be used for evaluating display performance. Consumer-grade displays such as smart phones and televisions are also measured according to JND standards.
Application of JND to Display Quality
The JND scale is defined so that a JND difference of 1 would be just noticeable. On an absolute scale, a JND value of 0 represents no visible spatial contrast and an absolute JND value of 1 represents the first noticeable spatial contrast. For display technologies, this scale enables defects to be graded according to their severity. Factors included in the JND model include spatial frequency (how fast spatial contrast varies), orientation (the angular orientation of the spatial contrast relative to the viewing plane defined by human eyes), and the observer’s distance from the display being viewed.
The SSO operates on a digital image or a pair of digital images, which means it can be used with digital imaging systems, such as a computer-controlled imaging photometer or colorimeter like Radiant’s ProMetric® series. The imaging system captures data on spatial distribution of display image luminance and color, and then this data is analyzed to create a JND map of the image.
The NASA algorithm has been licensed from and adapted for use in Radiant Vision Systems image analysis software to allow ready application to display data. In general, either a photopic or colorimetric measurement image can be used to enable display images to be graded with a direct correlation to human visual perception of luminance and color. Using JND analysis, display defects like mura (blemishes and non-uniformity) can be identified and graded according to their severity.
Implementation of JND Algorithms for Automated Display Testing
Using JND analysis to evaluate display uniformity identifies the change over a surface area that will be noticeable to an average person at least half of the time. Radiant’s TrueTest™ Software with TrueMURA™ incorporates JND qualification to evaluate non-uniform areas in illuminated displays that would be deemed unacceptable by a human observer.

Identifying and grading defects that represent a “just noticeable difference” (JND) to an average human observer at least half of the time.
The JND analysis function processes a captured image of a display to generate a JND mapping of the image. The algorithm also outputs three JND metrics that may be used to grade the visual quality of the display. This has immediate value for production-line applications; for example, in both LCD fabrication facilities and final display assembly lines.
Display manufacturers can use human noticeability values to set pass/fail parameters for certain types of mura—when present. Areas of non-uniformity in the center of the display may be more of a distraction to users than defects toward the edges or corners of a display, thus internal quality standards may be set for tolerances of 90-100% uniformity for spot mura that appears in the display center, while 80% uniformity for edge mura may suffice.

Raw JND analysis of a screen image (top) captured by a ProMetric Imaging Colorimeter and TrueMURA Software. The image is lighter for higher values of JND and darker for lower values, showing mura at the center of the screen and light leakage and dark spot artifacts along the edge. A false color representation of the JND map (bottom) shows areas with JND values greater than 1, which is the threshold for being "just noticeable". The spot in the bottom right has the largest computed value of JND, and the mottled area across most of the display represents JND values of 0.7 or lower.
Display defect detection performed using this type of system demonstrates that JND analysis is an effective means of obtaining additional information about display image quality that extends to other analysis techniques. This analysis system can be applied to any display type, including LCD, LED, and OLED displays. As with illuminated displays, JND measurement can be applied to non-illuminated surfaces for detecting and grading “uniformity” issues on surfaces caused by scratches, dents, smudges, debris, and other defects.
To learn more about JND and its application to display measurement and inspection, read the whitepaper “Methods for Measuring Display Defects and Mura as Correlated to Human Visual Perception.” Accurately correlating human perceptions of defects with the information that can be gathered using imaging colorimeters offers an opportunity for objective and repeatable detection and quantification of such defects.
In the white paper, you will learn about JND characterization and implementation of JND algorithms for automated display testing to detect and grade mura and other defects according to the human visual experience.
CITATIONS
- Spatial Standard Observer, United States Patent 7,783,130 B2, March 20, 2012
- Spatial Standard Observer (SSO), Technology Solution, NASA 2015
- “The Spatial Standard Observer”, Information Technology Tech Briefs, September 1, 2006
Join Mailing List
Stay up to date on our latest products, blog content, and events.
Join our Mailing List

