Light It Up: Capturing Measurement Data for Lighting Design
The invention of the electric light bulb changed the world. It enables human activity at all times of day or night, and in all ambient light conditions. The first commercially available bulbs were released in 1880, manufactured by Thomas Edison’s company, the Edison Electric Light Company. The resulting demand for electric lighting propelled the building of vast electrical distribution infrastructure to bring power to homes and businesses in the following decades.
“The light bulb also had wide-reaching social and economic consequences. Interior lighting changed the structure of society, allowing activities to extend into the night. Industrial plants and other businesses could operate all night long, dramatically increasing profits. Electric lighting also allowed cities to stay active into the night, changing the natural rhythm of society and allowing people to stay up later.”1
Lighting is now a multi-billion-dollar industry, with numerous segments and sub-segments: industrial, residential, commercial, automotive, architectural, theatrical/entertainment, outdoor, medical, and more.
Over time, manufacturers have offered a range of light bulb technologies including incandescent, fluorescent, halogen, xenon, and compact fluorescent (CFL) lights. Now LEDs (light emitting diodes) have captured the majority of sales and continue to grow, with some analysts projecting that LEDs will hold a 95% share of worldwide lighting sales by 2025.2
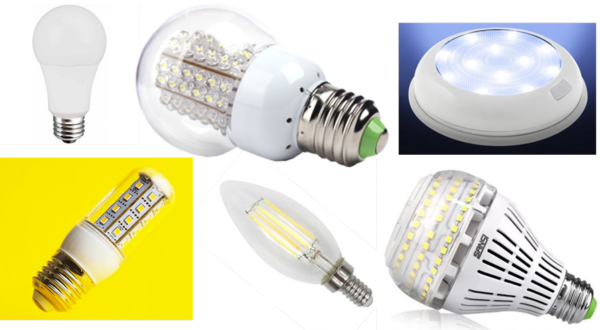
Examples of modern LED bulbs. Each contains an array of small, individual diodes that combine to provide energy-efficient light. Different numbers and arrangements of the diodes create bulbs that cast light in different directions and at different luminance levels.
The Art & Science of Lighting Design
When lighting an environment, e.g., a home or office, there are multiple factors to consider, such as ergonomics, aesthetics, energy efficiency, cost, and safety. Balancing these considerations helps a lighting designer to determine the optimal lighting configuration for different situations.
In some environments, ergonomics (work efficiency) is the most important objective of lighting design. For instance, lighting in an airplane cockpit must be sufficiently bright and correctly distributed to allow pilots to see important instruments as they fly. Commercial lighting must evenly illuminate an office space and reduce glare on computer screens to allow workers to easily accomplish their tasks.
Brightness (luminance) plays a critical role in lighting ergonomics. In an operating room, for example, bright light is imperative for visibility during surgical operations. Yet light also shouldn’t be so bright that it creates glare and poor contrast for various displays and monitors that the medical team relies on during a procedure.
In addition to luminance, color plays a critical role. Various lighting colors and temperatures can affect a surgeon’s ability to visually distinguish color differences that indicate tissues types and tissue health. For example, red-hued lighting impairs the visualization of red objects (tissues, veins, wounds) and creates eyestrain (both physical and psychological) for surgical staff.3

Designing lighting with the correct combination of luminance (brightness) and color is the challenge in certain mission-critical work environments such as surgical operating rooms or airline cockpits.
New Technologies and Approaches
The advent of smart devices and the Internet of Things (IoT) is revolutionizing how lighting works, allowing interconnected and automated systems that adjust themselves based on sensor feedback or are controlled remotely. A new development is “LiFi” (Light Fidelity)—using light waves to send data in places where WiFi cannot be applied, faster and more securely.
In recent years, a focus on the effect of light on human health has given rise to the Human Centric Lighting (HCL) approach. The goal of HCL is to eliminate any negative effects of long exposure to artificial light sources, which can disrupt the body’s natural rhythms and adversely affect psychophysical fitness. For example, blue light has been shown to interfere with circadian cycles.
The impact of poorly designed light environments can include lower productivity, fatigue, problems with concentration, irritability, and insomnia. Some studies have even shown a link between lighting conditions and both depression and appetite.4 HCL solutions include automatically adjusting lighting throughout the day and adapting light to different types of rooms and types of work being done. HCL has brought new attention to the importance of color “temperature”.
The Effects of Color Temperature
Color temperature is a way to describe the appearance of light from a light source. It’s measured in degrees Kelvin (°K) on a scale from 1,000 to 10,000. Typical Kelvin temperatures for commercial and residential lighting applications range from approximately 2000K to 6500K. Light at the lower end of the scale is considered “warm” and at the upper end is “cool”. More specifically:
- Higher color temperatures (4,600K or more) appear blue-white and are called cool or daylight colors.
- Mid-range color temperatures (3,100K–4,600K) appear cool white.
- Lower color temperatures (up to 3,000K) range from red to yellowish-white in tone and are called warm colors.5
In everyday life, some examples of how color temperatures may look to us include:
- The glow from firelight is about 2,000K and is considered a warm color.
- A typical sunny day is about 5,000K or 5,500K and is considered a cool color.
- An overcast winter day is measured at about 7,000K and is considered a cool color.
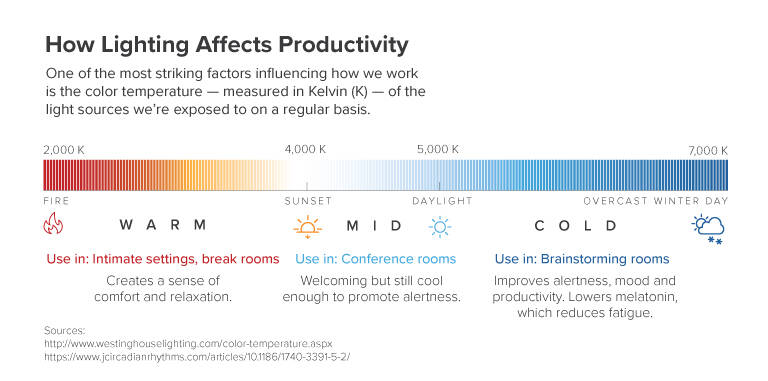
How lighting color temperature—from warm to cool—can affect human mood, energy, and productivity in the workplace. (Image Source)
Humans are very sensitive to differences in the brightness and color temperature of light. For example, cooler light helps workers to be more productive, and exposure to natural (cooler) light in the morning and evening has been found to decrease depression and improve mood, energy, alertness, and productivity.5 Light can also affect behavior in retail environments. In one study, changing the lighting design in a store increased average sales per customer by as much as 12%, and customers spent more time in areas lit with warmer-colored light than in areas with cooler tones.6
Measurements for Lighting Design
To develop the optimal lighting configuration for any environment, designers need accurate data about the brightness (luminous intensity) and color (chromaticity, or color temperature) of light sources, fixtures, and luminaires. For example, luminous intensity data enables lighting designers to observe the total output and angular spread of a light source in a space. Photometers, spectrometers and colorimeters are tools commonly used to measure these characteristics of light and capture information in photometric data files.
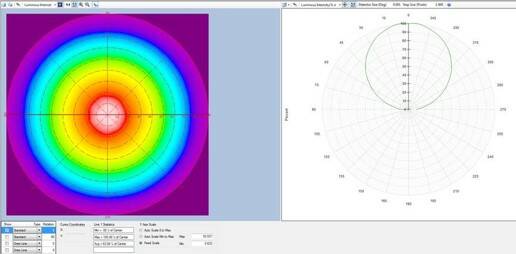
IES (*.ies) and EULUMDAT (*.LDT) are the two standard file formats used for electronic transfer of photometric data. An IES file can be thought of as a map of the luminous intensity distribution of a light source, specifically, the intensity unit candela in relation to view angle. (For an explanation of lighting measurement terminology such as candela, refer to our blog post, The Language of Light).
The image below shows a view angle radar plot of a light source’s luminous intensity distribution (left) and a polar diagram highlighting a cross section of that intensity plot (right).
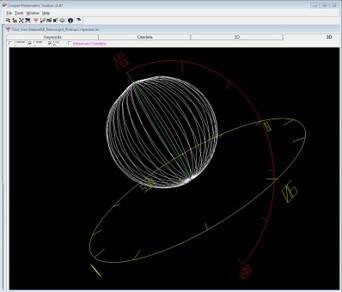
The image below uses an IES file viewer to look at the same radar data from the images above, mapping the measured points and using the radar data to provide the full representation of the light source.
To create IES and LDT files, designers have their choice of systems. Traditionally, goniophotometers have been used to generate very accurate photometric data; near-field measurement systems are also an option.
Radiant offers both near-field and far-field methods for measuring luminous intensity and illuminance distribution, as well as a light source’s Unified Glare Rating (UGR), to ensure that brightness, beam patterns, and glare are accurately defined for the optimal ergonomic design. Our ProMetric® Imaging Colorimeters and Photometers—used in combination with goniometers (near-field), or for measurement of light source distributions on a wall or Lambertian surface (far-field)—enable convenient, automated, and comprehensive measurement of large light sources for developers of automotive, transportation, architectural, and other lighting applications.
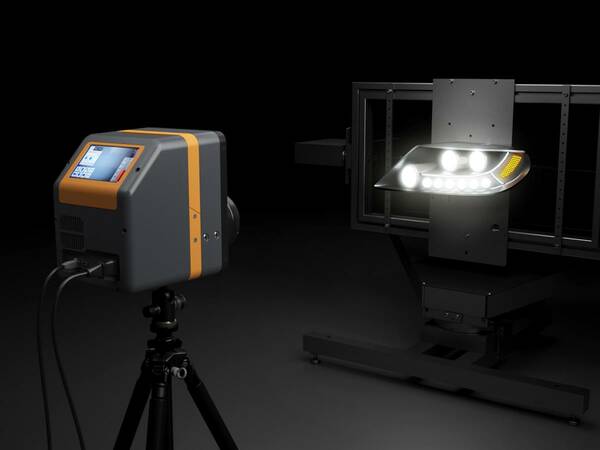
Measuring luminous flux at all angles of an automotive headlamp using a ProMetric imaging colorimeter and a goniometer for near-field data in a small dark room.
Radiant light measurement systems measure a light’s Correlated Color Temperature (CCT) over angle to determine a source’s temperature from cool to warm. A light’s CCT can innately enhance the color of objects when viewed under the light. Depending on the configuration, Radiant systems can also extrapolate Color Rendering Index (CRI) values (as well as CIELAB values) which can help to determine how natural colors appear under the light source.
The Data Files You Need
Measurement data captured by Radiant’s ProMetric® Imaging Photometers and Colorimeters and our ProSource® software can be analyzed and easily exported for use with most standard optical design software packages such as ASAP®, FRED®, LightTools®, LucidShape®, Photopia™, IES TM-25, Opticad®, OSLO®, SimuLux®, SPEOS®, TracePro®, and OpticStudio™ (ZEMAX), as well as general file formats.

Radiant’s ProSource® Software for light source analysis and ray set generation.
The measurement data collected by ProSource is formatted as an RSM™ (Radiant Source Model) file. This file contains all light source measurement information including the image data, so measurement results can be reviewed in detail at any time. RSMs are the most accurate method for describing the near-field output of real light sources in optical and illumination design software because they contain full measurement information, including luminance images, from all viewing angles for the light source or lighting system. This wealth of data provides full flexibility in analysis, in ray set generation, and in creating 3D models of different light sources.
Ray sets generated by ProSource from RSMs are more efficient than random Monte Carlo-generated ray sets as they contain equivalent information with only 20% of the number of rays—resulting in faster optical design analysis times with higher accuracy.
To learn more, explore Radiant's applications for light source modeling and measurement.
CITATIONS
- Ornelas, J., “The invention of the light bulb and why it changed the world”, December 8, 2014.
- “Top Trends in the Lighting Industry”, Civitta, April 25, 2019
- Yahnke, C., “The Science Behind Properly Lighting an Operating Room”, Healthcare Lighting Series White Paper: #HC010, published by Kenall, retrieved October 16, 2019.
- “How Lighting Affects the Productivity of Your Workers”, University of North Carolina Kenen-Flagler Business School, September 11, 2017.
- “Understanding Color Temperature: Create Ambience with Light”, Westinghouse, retrieved October 16, 2019.
- Faithfull, M., “Does lighting boost retail sales?”, LUX Review, June 9, 2015
Join Mailing List
Stay up to date on our latest products, blog content, and events.
Join our Mailing List
